Black Friday Market Outlook & Recap
Mid-Week Market Report
Hello folks!
Happy Thanksgiving!
I got a short market recap for you all before I get into my holiday festivities.
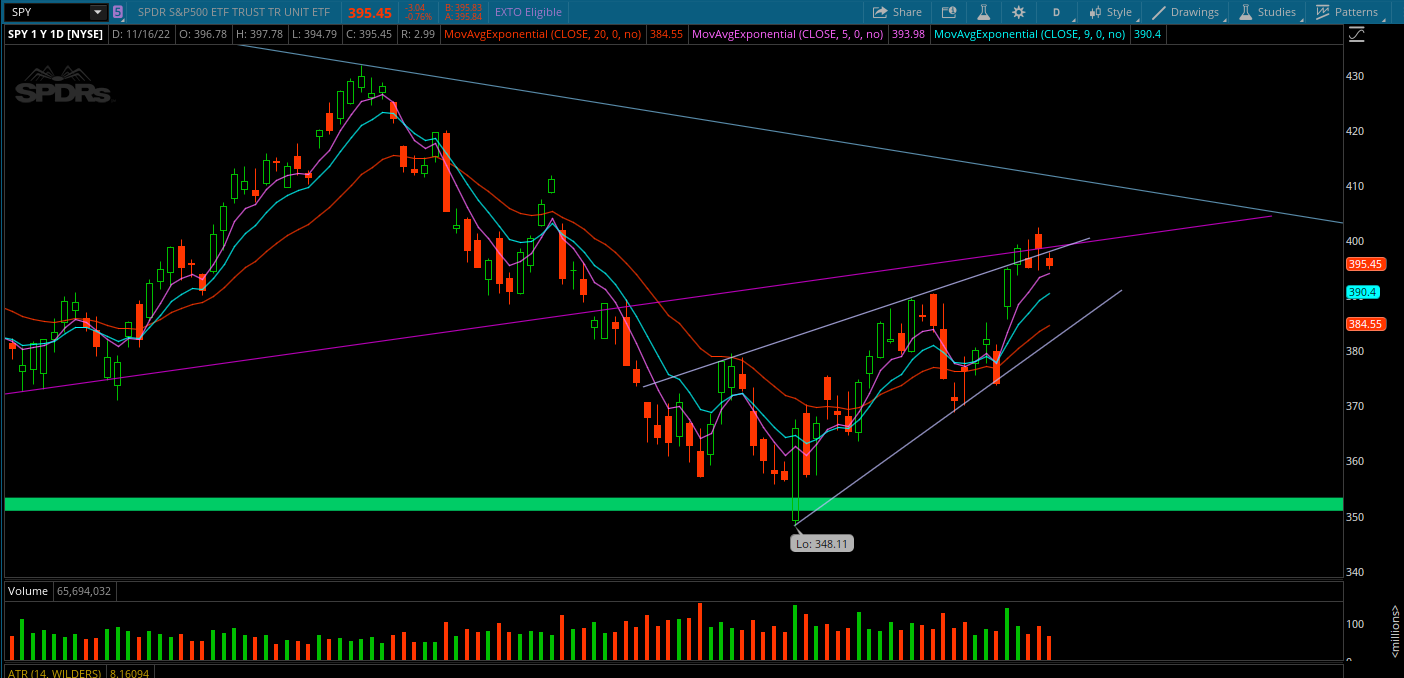
In my Friday webinar, I mentioned SPY could see the 20 day moving averages before another leg higher.
As of now, this test has yet to happen and SPY is trying to close the weekly candle above the bear flag and above the COVID 2020 low trendline.
If the market can close above these levels after Friday’s close, it would be a great first step for bulls for an end-of-year rally. At this point, it seems most probable.
Let’s check out the charts.
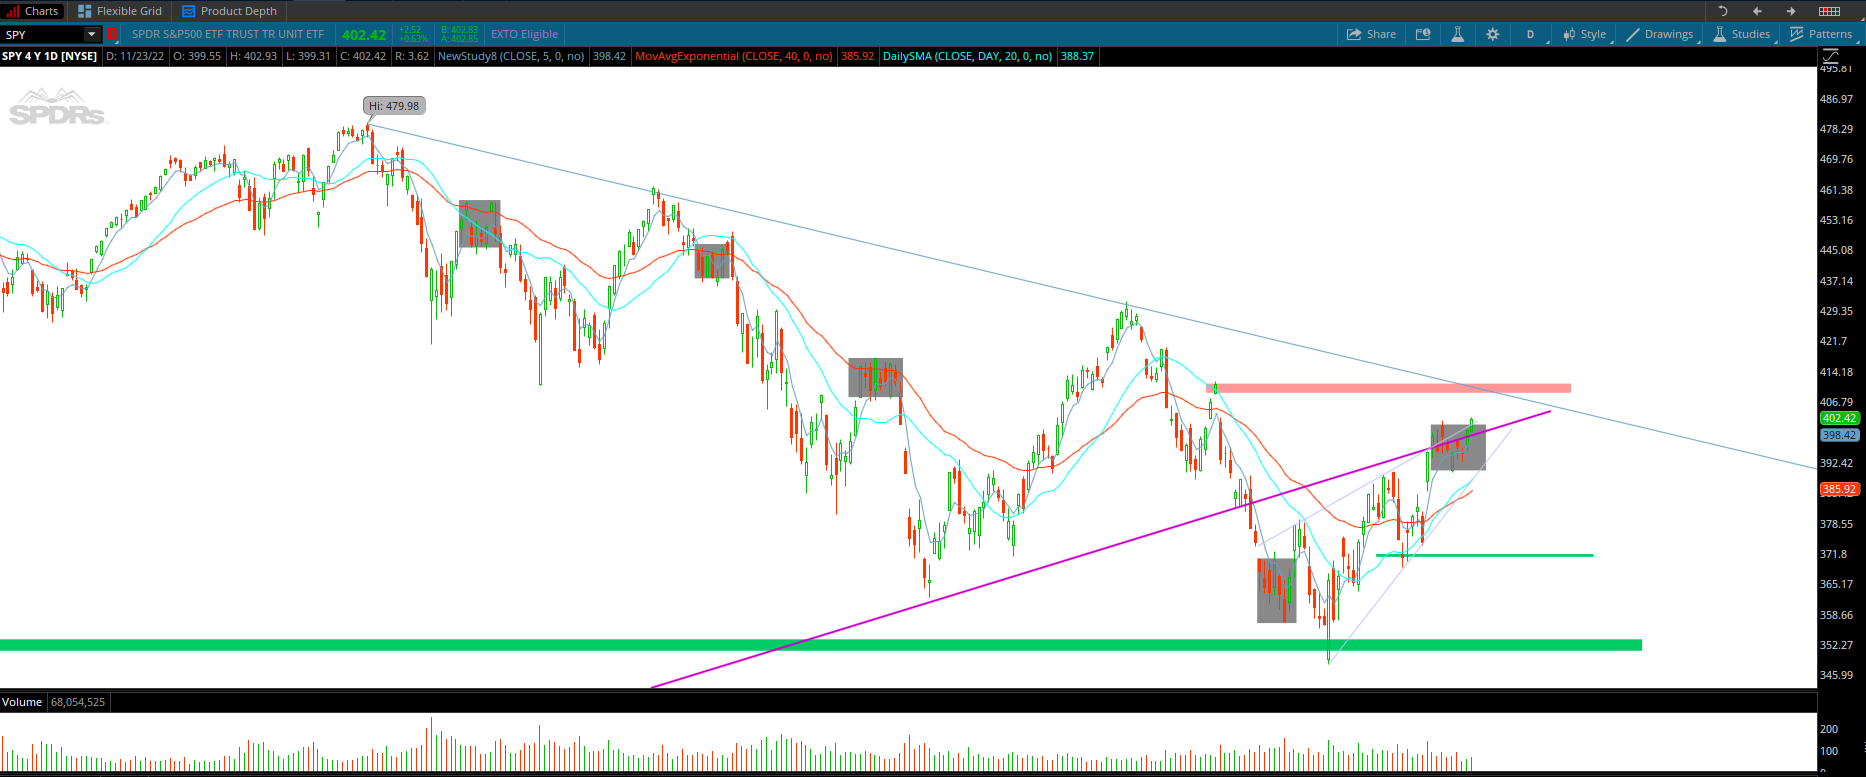
Purple Line – COVID 2020 Low trendline
Red zone – Supply Zone
Green Zone – Demand Zone
Grey Boxes – Darvas Boxes
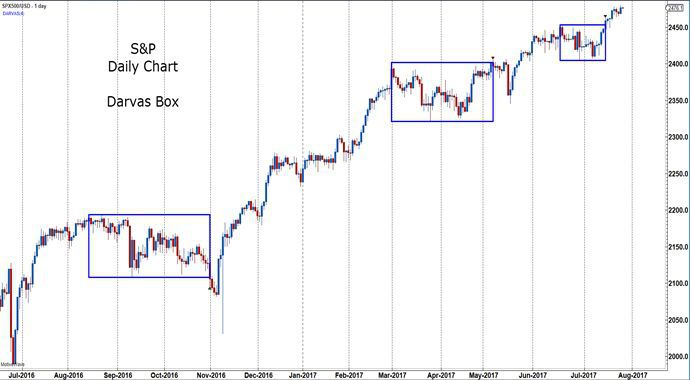
We’re working on our 5th Darvas box of 2022.
On average, we see 8 candles per Darvas box in 2022.
Today was day 8 for our current box and before the close, the box closed higher out of the box.
As you can tell from the chart, when we consolidate in these boxes for a sustained time, a large move typically occurs.
Assuming we can hold this level through Friday’s close, then we will have another element in favor of a rally into the end of year.
Seasonality speaking, this is the most bullish time out of the year.
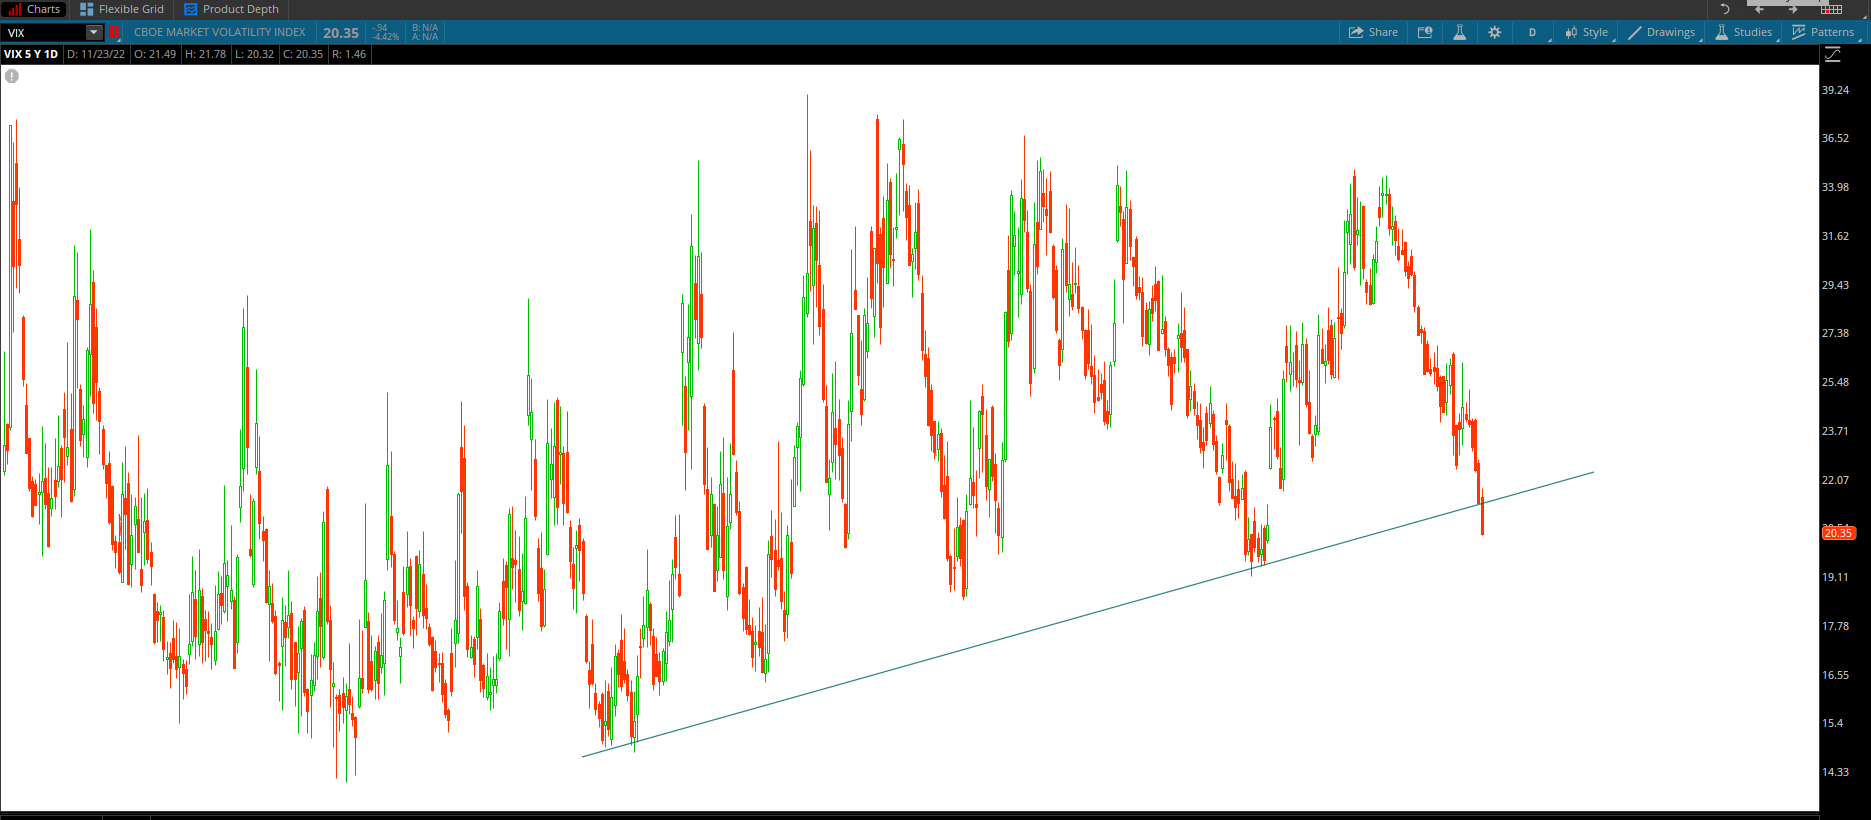
We are now seeing VIX break down through a 12-month trendline on the daily chart.
Everything is adding up to be bullish correct?
That’s how I’m seeing the market; however, holding a bias can be a hindrance.
I recommend taking the approach that the market appears bullish until proven otherwise.
If SPY were to flush on the day after Thanksgiving, like it did last year, then I would be very hesitant to be bullish.
Another rejection at the top of the bear flag trendline and a rejection out of the COVID 2020 trendline would not be ideal for bulls.
A close below the Darvas box would also be concerning for bulls.
Friday is a big day for me technically speaking.
Be nimble in these markets and take the market day by day.
I will be going live again on Friday at 12:30 pm ET for a Q&A and an additional market recap. Remember, the market will be closing at 1 pm ET on Friday.
Please feel free to send any questions to me at [email protected] and I will be sure to answer you via email or during the live session.
We will also be doing a Black Friday sale on Friday and Monday so be on the lookout for the sale if interested. As a subscriber, you will have priority on all questions and a more detailed market outlook.
This is one of the few days out of the year that we mark down subscriptions substantially so if you are interested, this weekend is the time to get the best deal.
In the meantime, we have a lot of food to eat, family and friends to relax with, and plenty of football to watch.
My Dallas Cowboys kick off at 4:30 pm ET on Thanksgiving so some well wishes would be appreciated!
Also, if you’re reading this, you are considered privileged by a global standard so remember to be thankful.
It really is a privilege to be able to talk markets to you all for a living so I appreciate all of my subscribers who support me.
Thank You!
My best wishes to you and your family during this holiday season.
–Dylan
(Head Analyst)
Mid-Week Market Report
Good afternoon folks!
I hope everyone has had a great week so far.
I just wanted to dive into what the market was presenting us and what to watch for as the week comes to a close.
But first, congratulations to my 2-Day Trader subscribers who were able to get the 104% profit on the APPS calls yesterday!
Alright, let’s dive into the market.
Looking at the SPY daily chart, we see that the market is indecisive on whether to invalidate the bear flag or fall back into the bear flag.
I sent out an email to you all on Monday stating the bearish nature of other indices, IWM and DIA mentioning if those names struggle it would decide the next direction of the market.
And after two days, IWM is setting up something very interesting. I’ll get to that in just a moment.
Here’s the SPY weekly chart and what to watch for.
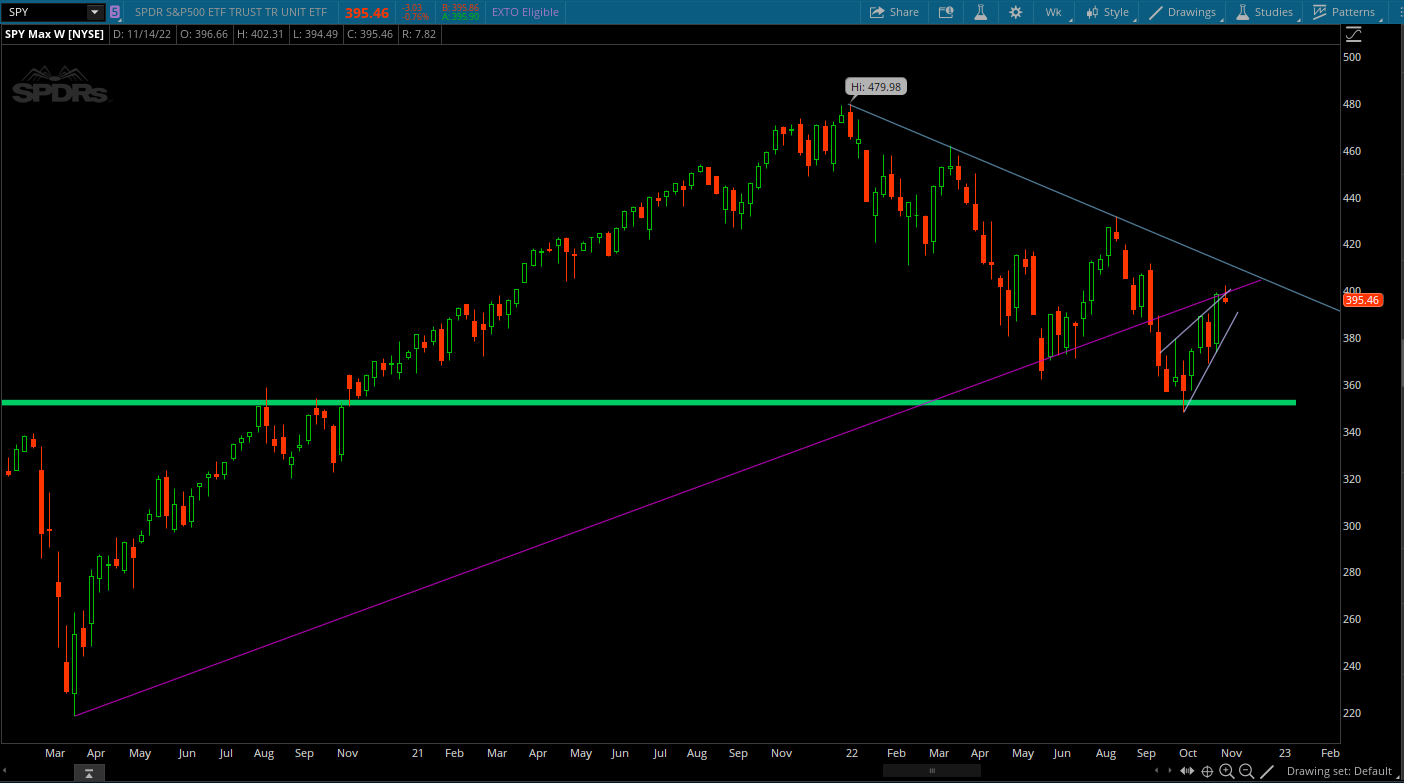
I have been mentioning to the 2-Day Trader subscribers in our weekly market commentary that the 2020 COVID low trend line would need to be tested before additional selling would occur.
On Friday, we tested this trend line and it is proving to be a battleground in the market.
The bulls were able to invalidate the bear flag on the weekly but I cautioned subscribers to watch for a false breakout.
As of now, bulls are struggling to gain traction in this zone and it is starting to set up a bearish look until proven otherwise.
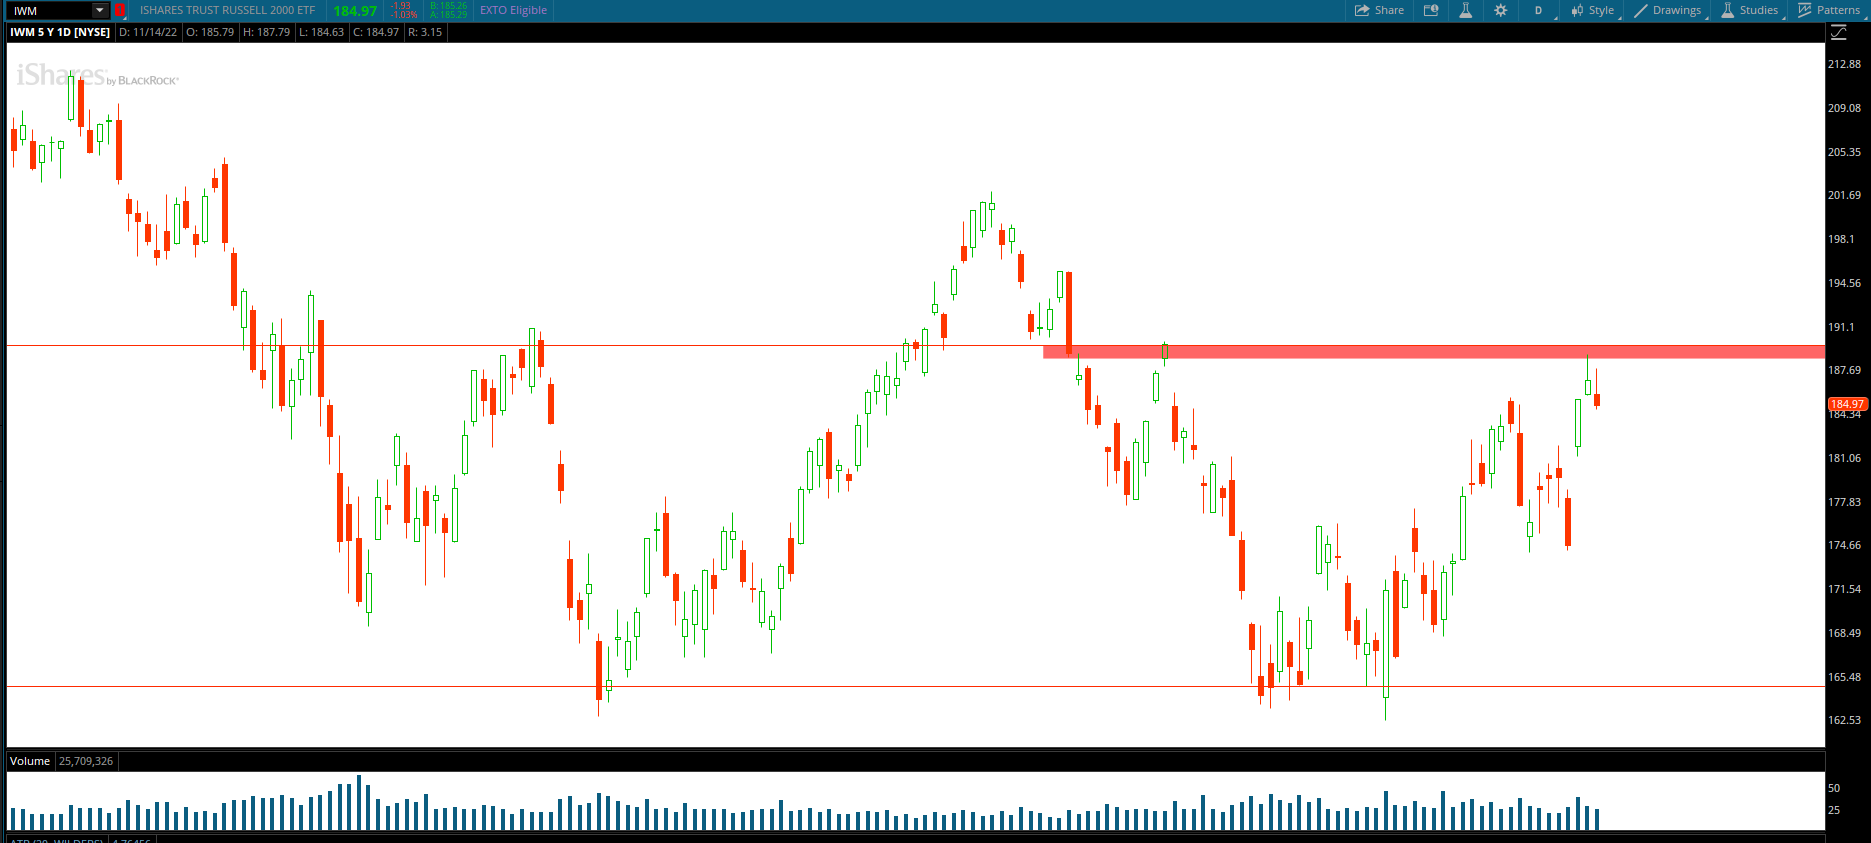
Let’s check back in on IWM.
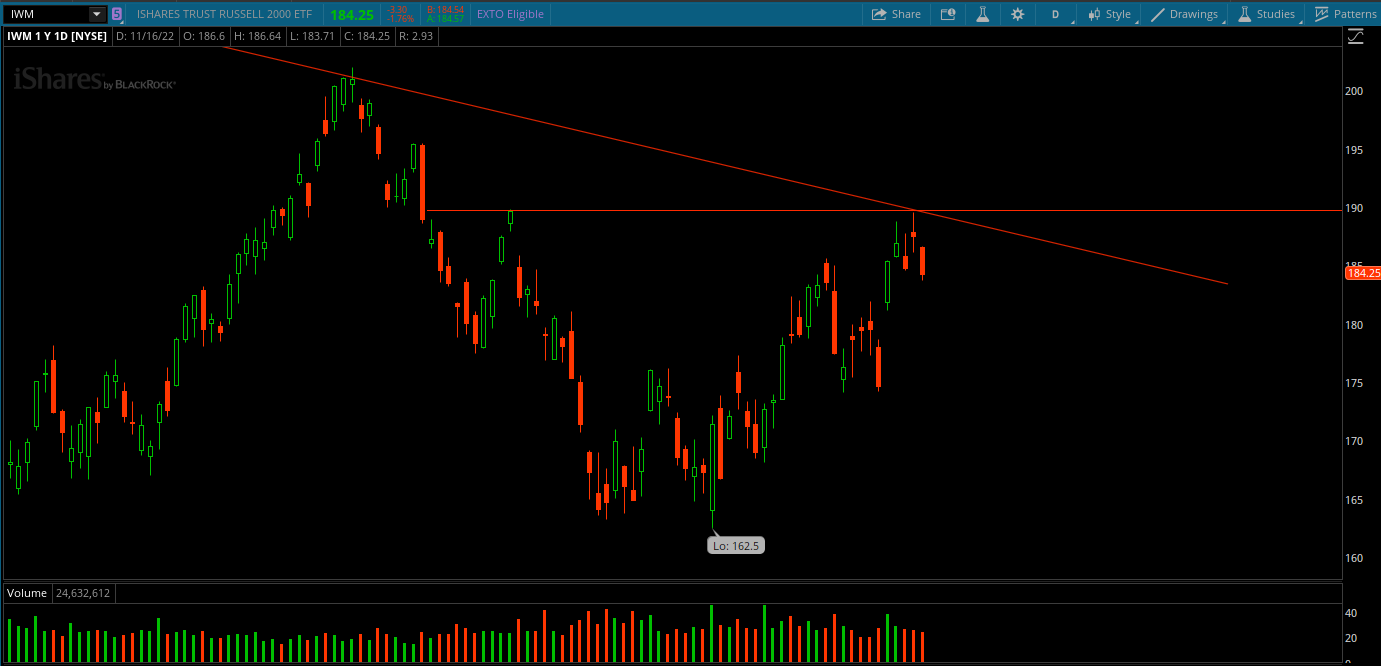
This is the most bearish chart of all the indices at the moment.
A double top rejection right at trend line resistance. Yesterday, IWM closed with a spinning top candlestick and today was confirmation.
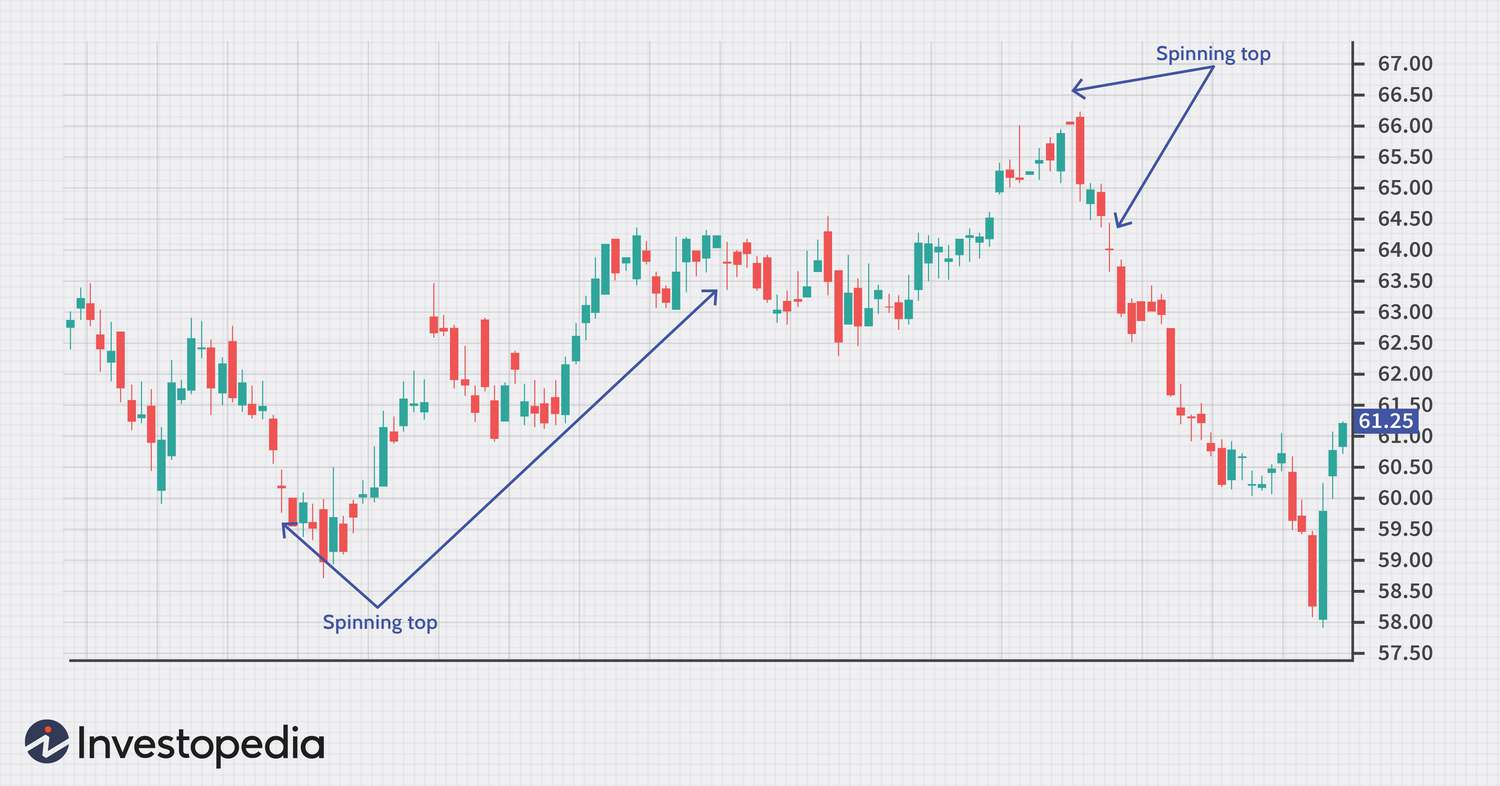
Spinning Tops simply show indecisiveness within the market.
Today’s gap down was the confirmation candle.
My trend lines aren’t present on the previous IWM screenshot, but a bear flag is present there as well.
So, what does all this add up to?
As I’m sure you could tell, the overall market is bearish to my eyes until proven otherwise.
Of course, the market is quick and can invalidate set ups quickly. You must stay nimble in this game.
I will be watching the SPY weekly chart for either a rejection off of the COVID 2022 trend line or a push higher through the trend line to determine my overall directional bias for next week.
SPY closed today with an inside day.
So for the absolute short term, a break and daily close below yesterday’s low would leave me bearish for Friday or a break and close over yesterday’s high would leave me neutral/bullish in the absolute short term.
If the latter were to happen, bulls would have a lot of resistance to fight through in the short term.
If you have any questions or comments, please feel free to email me at [email protected].
Also, I may do a free live webinar on Friday for a quick Q&A and market commentary session for next week. If you’re interested, please send me an email!
Enjoy your night and spend time with your friends and family. The charts will always be there.
–Dylan
(Head Analyst)
Most interesting indices to watch this week
Good afternoon, folks!
There are two tickers that I will pay special attention to this week.
IWM & DIA
These aren’t as popular as the S&P and the Nasdaq; however, these indices can be quite telling for the overall direction of the market.
Let’s look at IWM first.
Looking at this daily chart, there’s a couple of things going on here.
On Friday, IWM traded right into the daily supply zone from mid-September.
Supply and Demand zones are simply areas of interest where orders that were once unfilled may become filled again.
In September, IWM traded into this 188-189 area and led to a 5% sell-off in just two sessions. You can see that the bears didn’t stop there as they continued to sell throughout the remainder of September.
On Friday, IWM closed with a shooting star candlestick pattern.
Let’s take a look at the Dow Jones
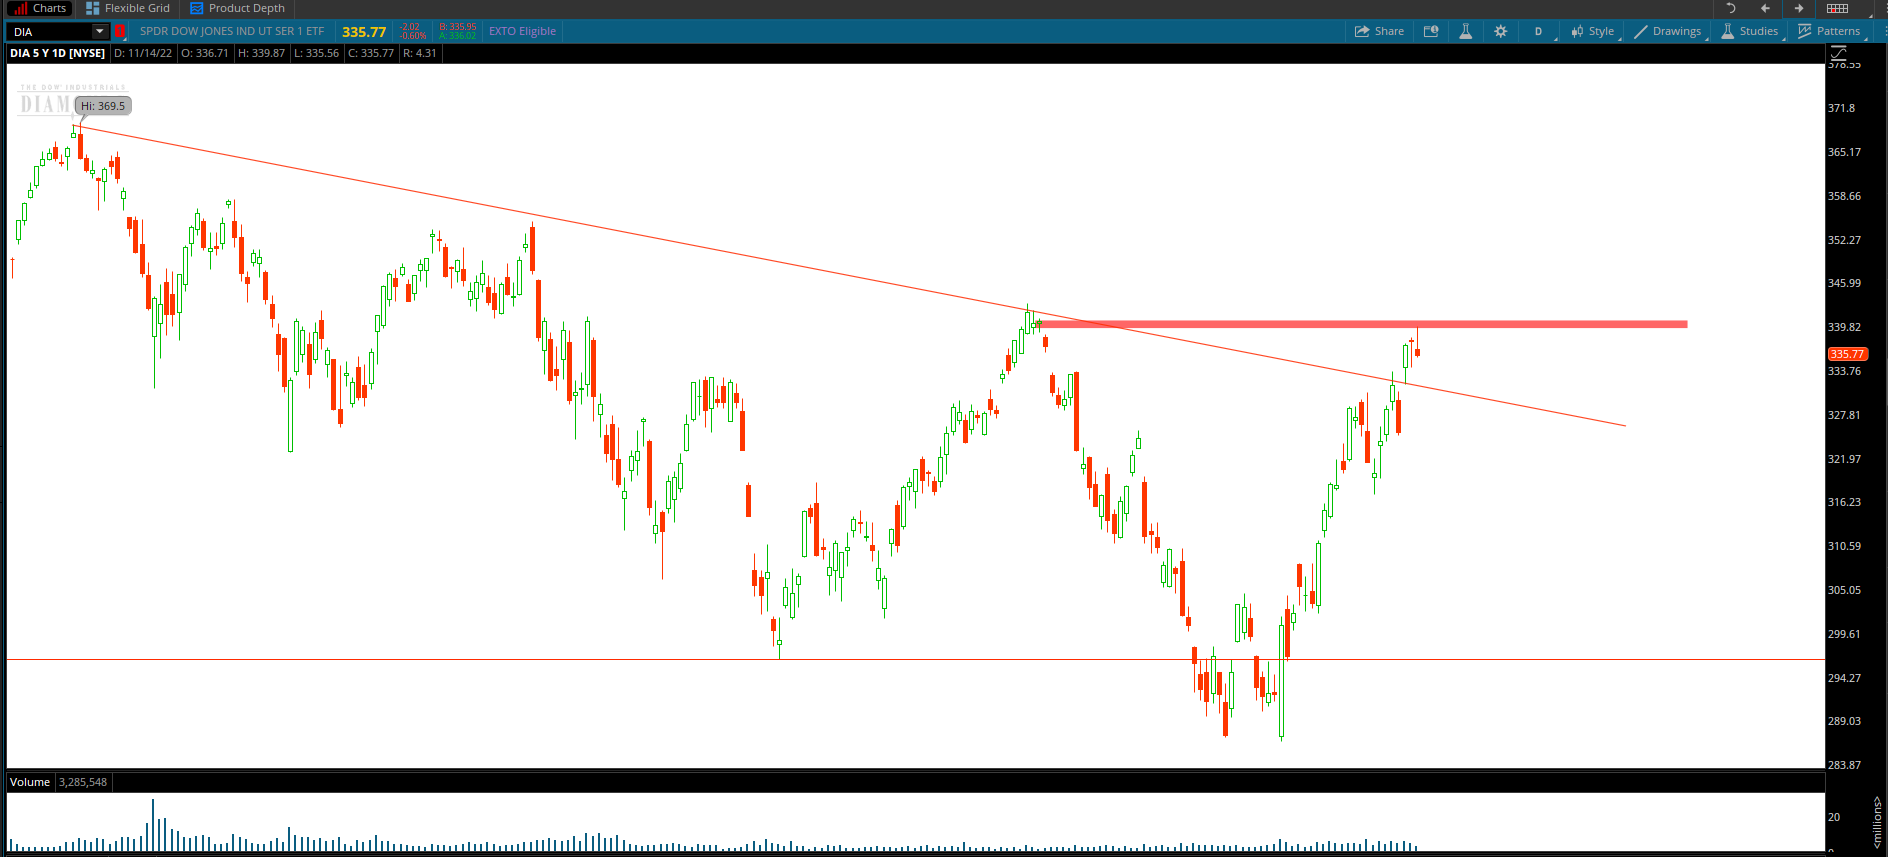
A Similar setup here.
DIA closed Friday with a hanging man candlestick pattern.
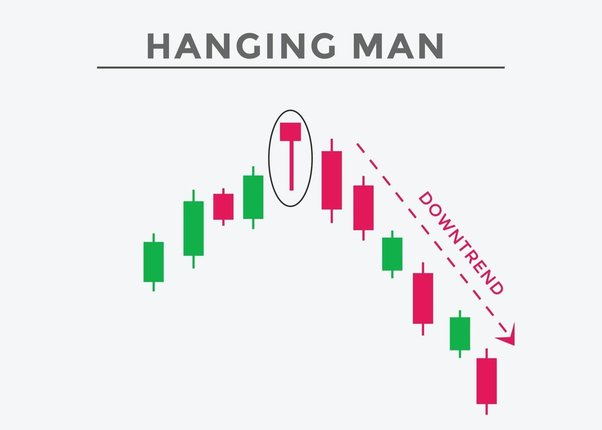
The hanging man needs a gap down the following day which we got today on DIA.
DIA did rally intraday but only right into another supply zone.
Right now, DIA is trading above its all-time high trendline for the first time in 2022.
Be mindful of a false breakout here on DIA.
If DIA closes back below 330, then it presents quite a bearish landscape for Dow names.
Tomorrow morning we have more macro data coming in, PPI print.
A lot can change the current landscape between now and tomorrow’s opening bell.
If bulls step in and bid the market tomorrow with a close above today’s high on both IWM and DIA, then the short setup will be invalidated and bulls may retake momentum.
Enjoy your week this week!
–Dylan
(Head Analyst)
Candlesticks and Market Psychology
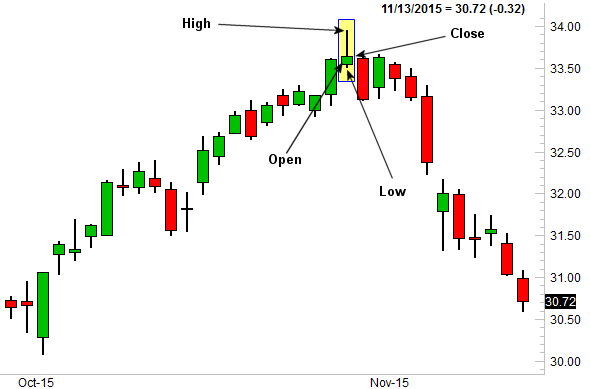
Candlesticks, originally developed by Japanese rice trader, Munehisa Homma, can offer a snapshot of price action and are often used as a fundamental tool of technical analysis.
A candlestick in charting is made up of four components, the high, low, open, and close of any given timeframe. Candlesticks can be used to summarize price action on daily, weekly, monthly chart. As well as short time frames such as hourly charts, 30-minute charts, 15-minute, and even one-minute charts. Just like in other aspects of technical analysis, timeframe matters! The longer your time frame, the more confidence you can have in the set up. Using a one-minute chart, it is very likely to get fake outs and find noise; whereas a daily chart can eliminate much of the noise and reduce fake outs.
Inside Day
Consolidation leads to amplification. Simply, an inside bar illustrates quick consolidation prior to a dramatic move. Due to a quick consolidation during a current trend, inside days are typically continuation moves. An inside bar is defined as the second bar, including wicks, trading completely inside the prior bar. The low must be higher than the low of the previous bar and the high must lower than the high of the previous bar thus creating an inside day candle. Inside bars will typically move in the direction of the current trend.
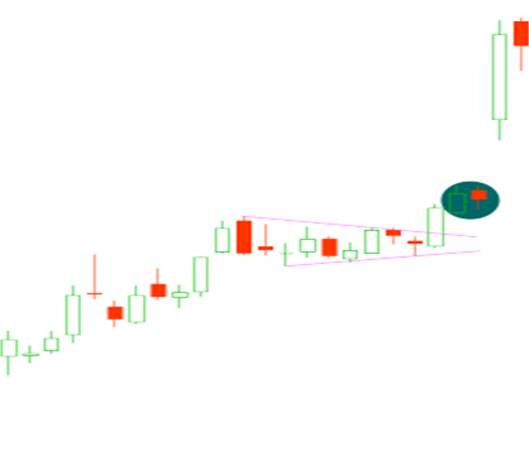
In this chart, we see a current uptrend that is now consolidating above a bull flag chart pattern. Price is now breaking through the flag and we have consolidation above the flag.
This tight consolidation shows that on a day of low volatility, bulls would not allow any budge below the prior days low and that the buyers are still present.
We often hear traders pump the brakes on these types of charts claiming the underlying stock is “too extended.” As a bull, when we get basing and consolidation, it shows that the bulls are upholding the underlying at a specific level and a lack of supply at that current level.
These quick consolidation moves can be very powerful and at 2-Day Trader, we focus on capitalizing on them.
Of course, using a candlestick pattern will prove inconsistent as there are frequent signals daily using this specific candlestick pattern.
At 2-Day Trader, we add additional indicators and go through further filtering to establish the highest probability trades. Inside days are simply a piece of the puzzle.
If you’re interested in further learning or joining the 2-Day Trader team, please click this link.
Join the other thousands of like-minded traders that trust the 2-Day Trader team’s research.