7.10.23 Q3 Outlook
3.22.2023
Good afternoon folks!
As promised, here is our Q2 Outlook.
We’ve had a lot happen over the last quarter of 2023. In fact, it is wild to me that Q1 is coming to a close in the next week.
Let’s talk about what we’ve seen in the last few months:
The FED has continued to hike rates – Jerome Powell still mentions soft landing is possible despite seeing aggressive rate hikes.
We saw some poor earnings from some of the biggest companies in the world. AAPL’s overall sales from the holiday quarter were down 5% compared to last year. This was the first year over year sales decline since 2019.
We saw similar reports and even companies reducing revenue guidance. We saw that in AMZN.
We’ve seen geopolitical landscape go a bit further into hostile territory.
We saw Silicon Valley Bank (16th largest bank) shut down just two weeks ago by regulators after a bank run.
So where did all of this leave the S&P?
Well YTD, (This is written prior to FED Announcement) the SPX is up nearly +4%.
This is a good time to remember that the market is always forward looking.
And what is the market forecasting on a macro landscape?
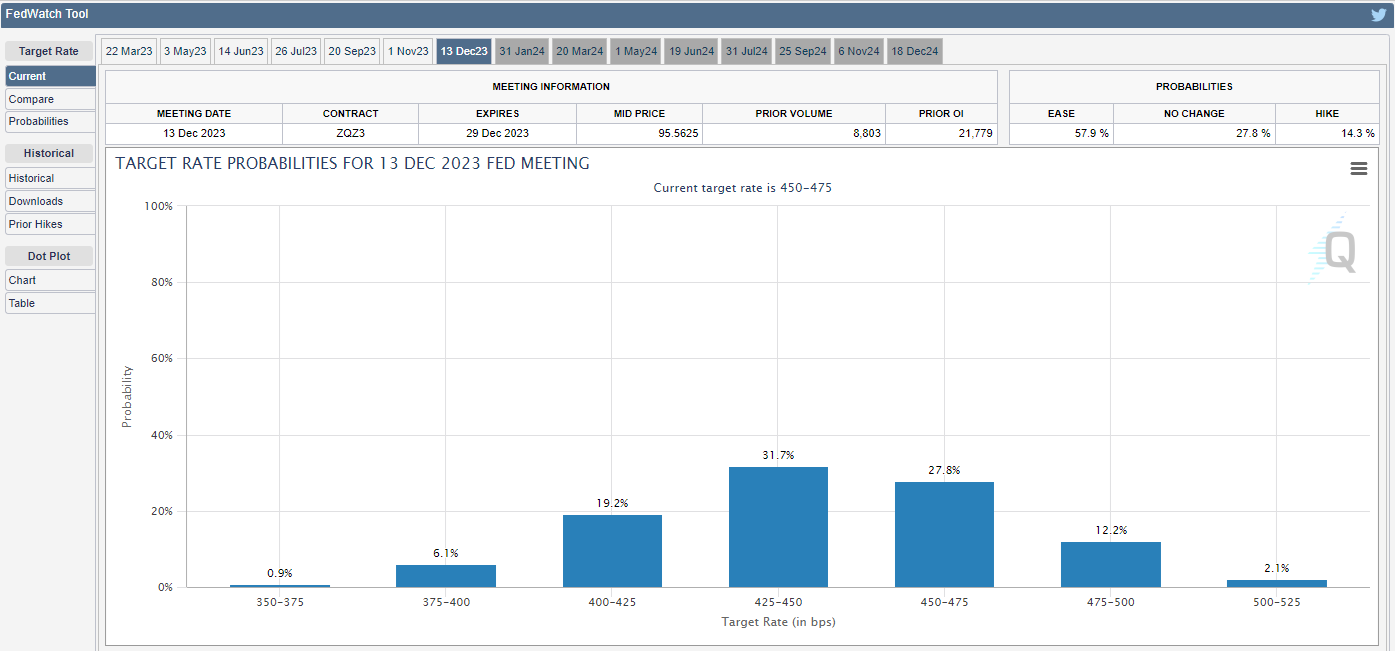
Right now, the probabilities lean towards a softening FED where we see rates a touch lower than where we are today.
Meaning, the market is leaning towards pauses in the upcoming months with a chance of a cut.
The only way that this can be deterred is higher than expected macro points (CPI, PPI, NFP etc.)
But as of now, the market is pricing in a fairly stable rate environment over the course of the next 9 months.
Remember, markets are forward looking.
Let’s dive into the charts.
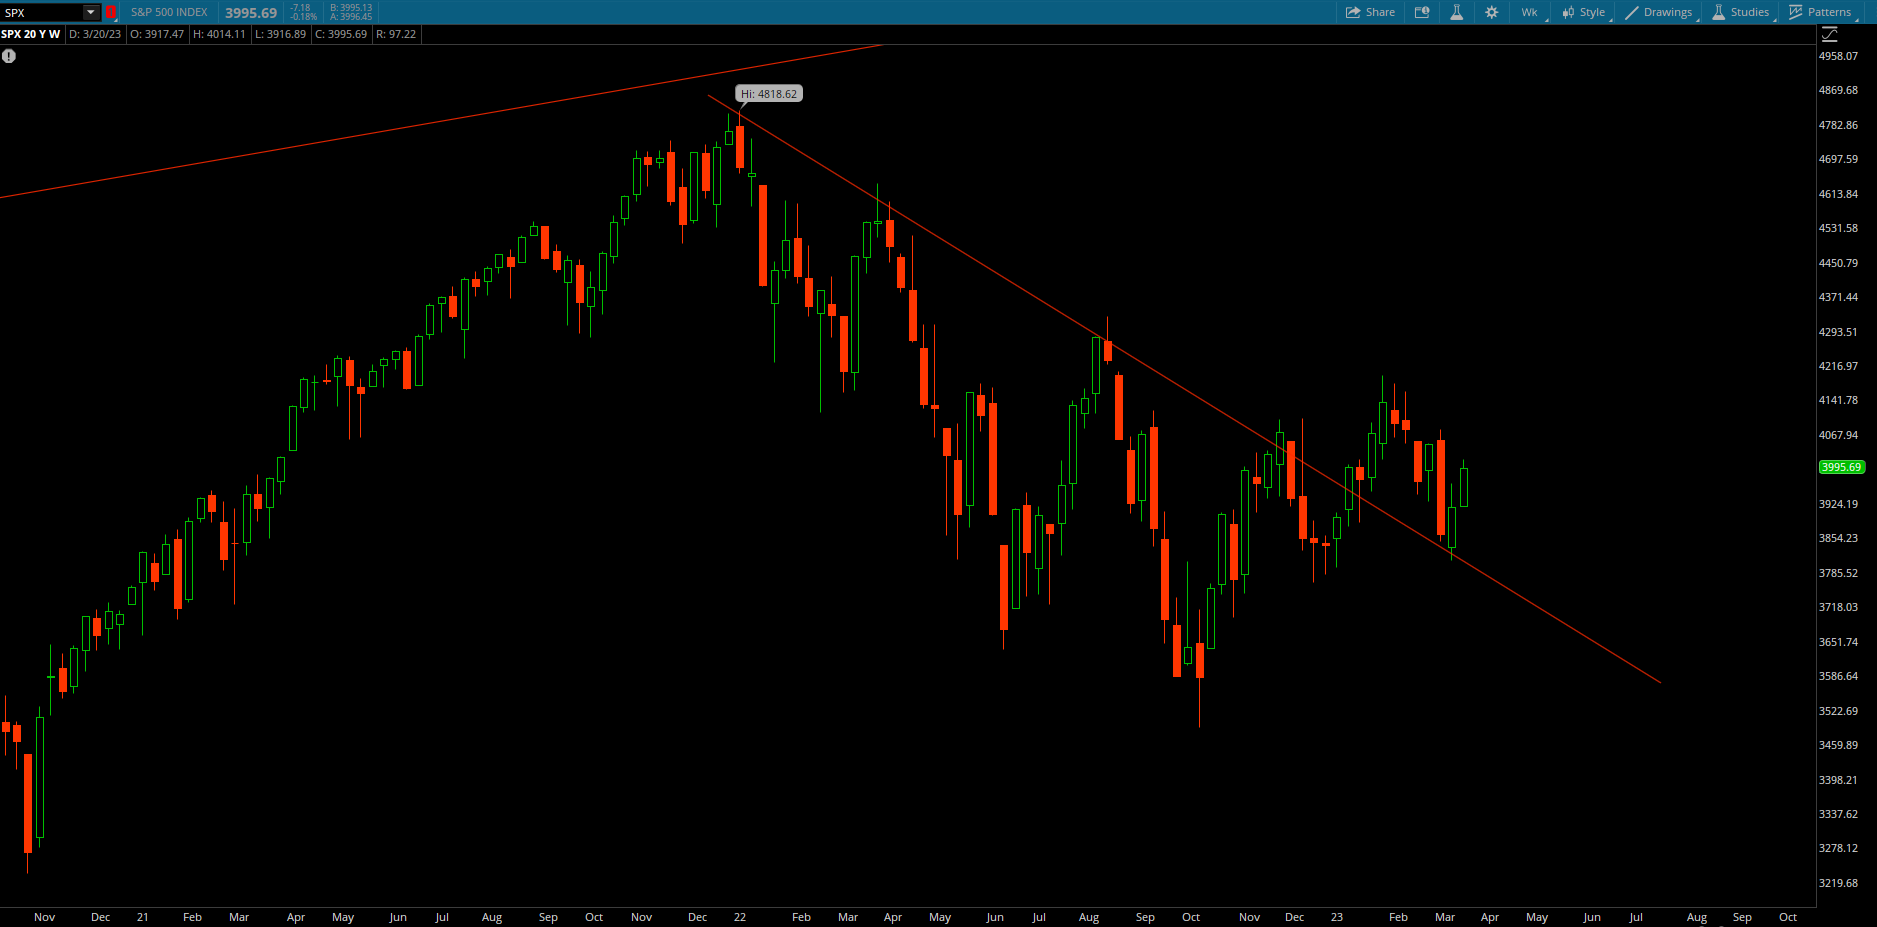
As of now, the bulls are doing everything they can to hold this ATH trendline.
Long time 2-Day Trader subscribers know this has been a crucial element for the U.S. financial markets since last year.
But as of now SPX, has been holding this critical area on every retest in 2023.
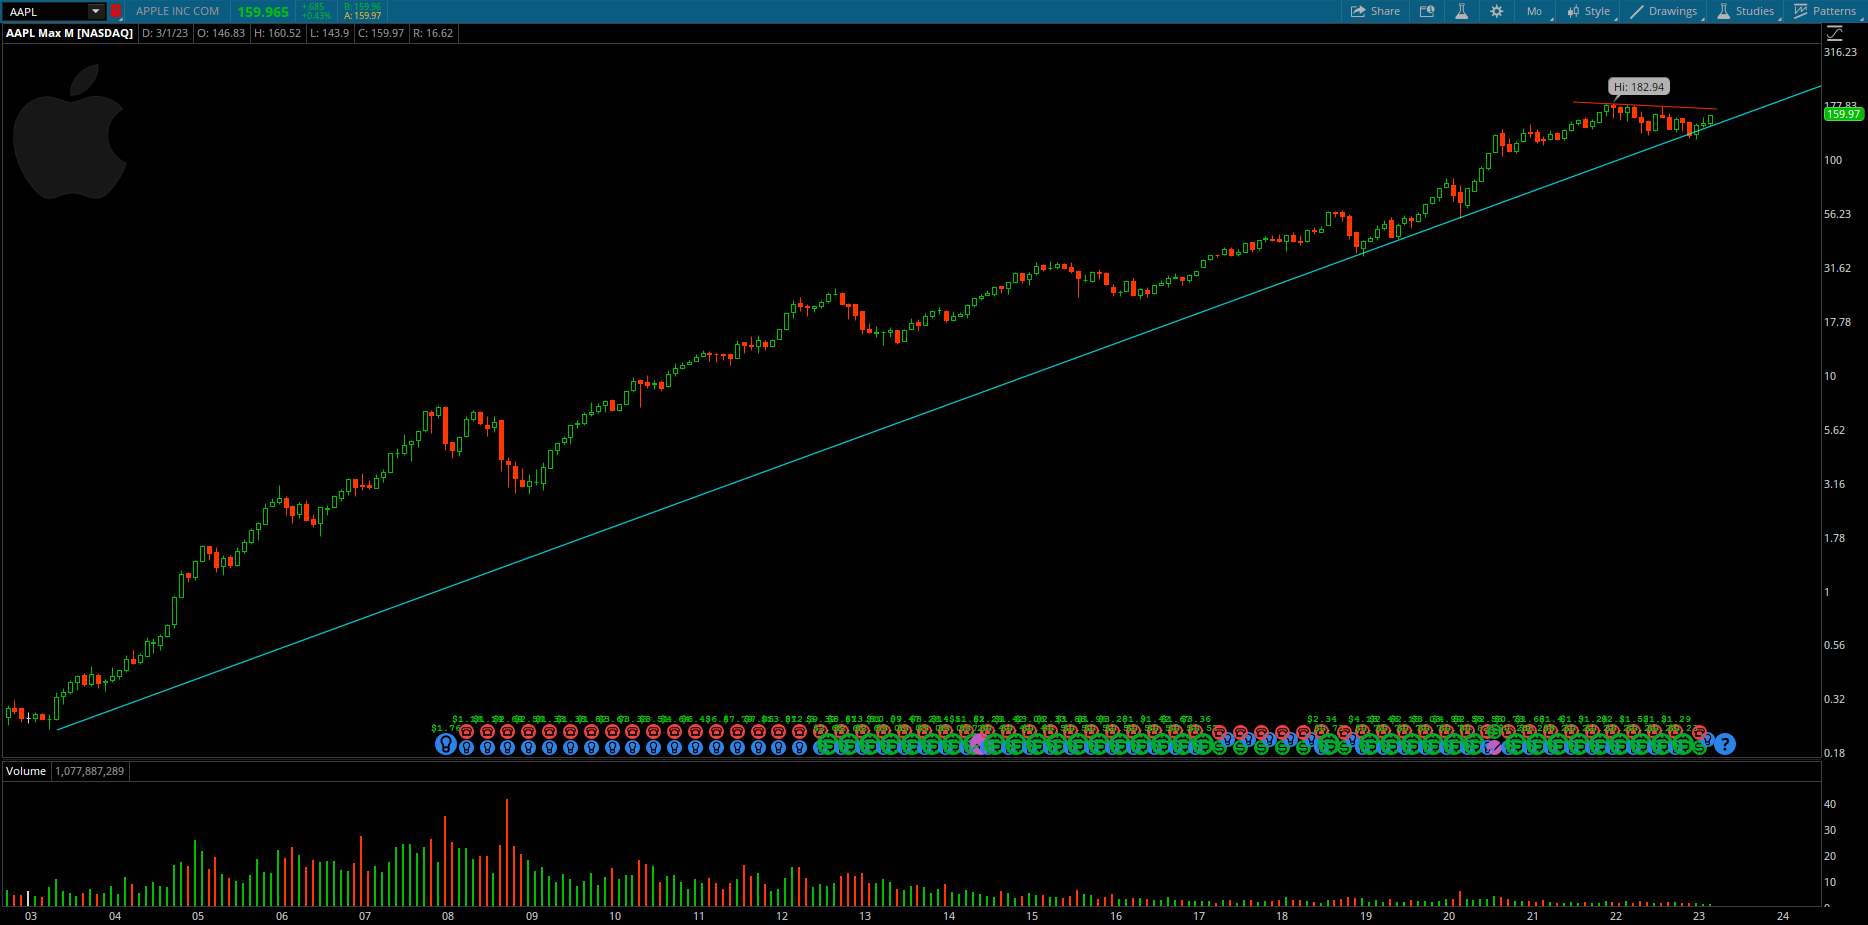
We’re seeing the biggest name of them all hold this major trendline support that started back in 2003.
AAPL, holding right where it needed to.
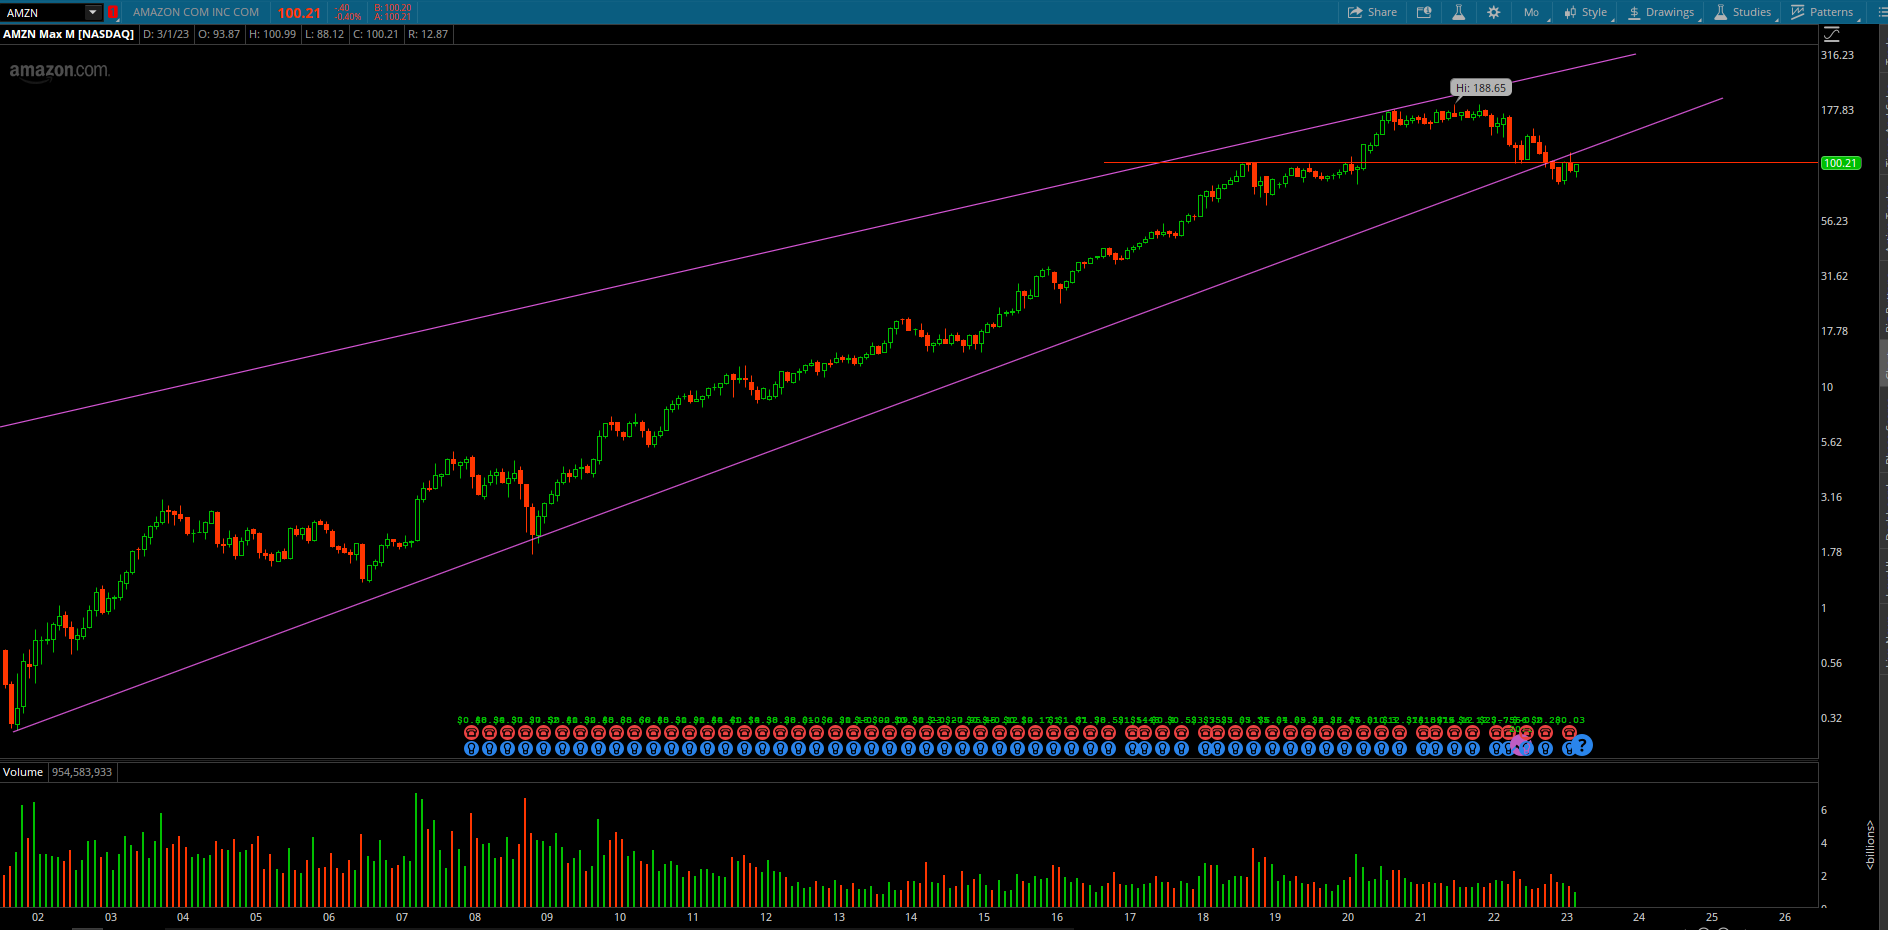
AMZN on the other hand… This isn’t ideal.
AMZN is getting rejected at a major support trendline (pink line) – acting now as resistance.
AMZN is also trading below its 2018 high after a couple years of consolidation.
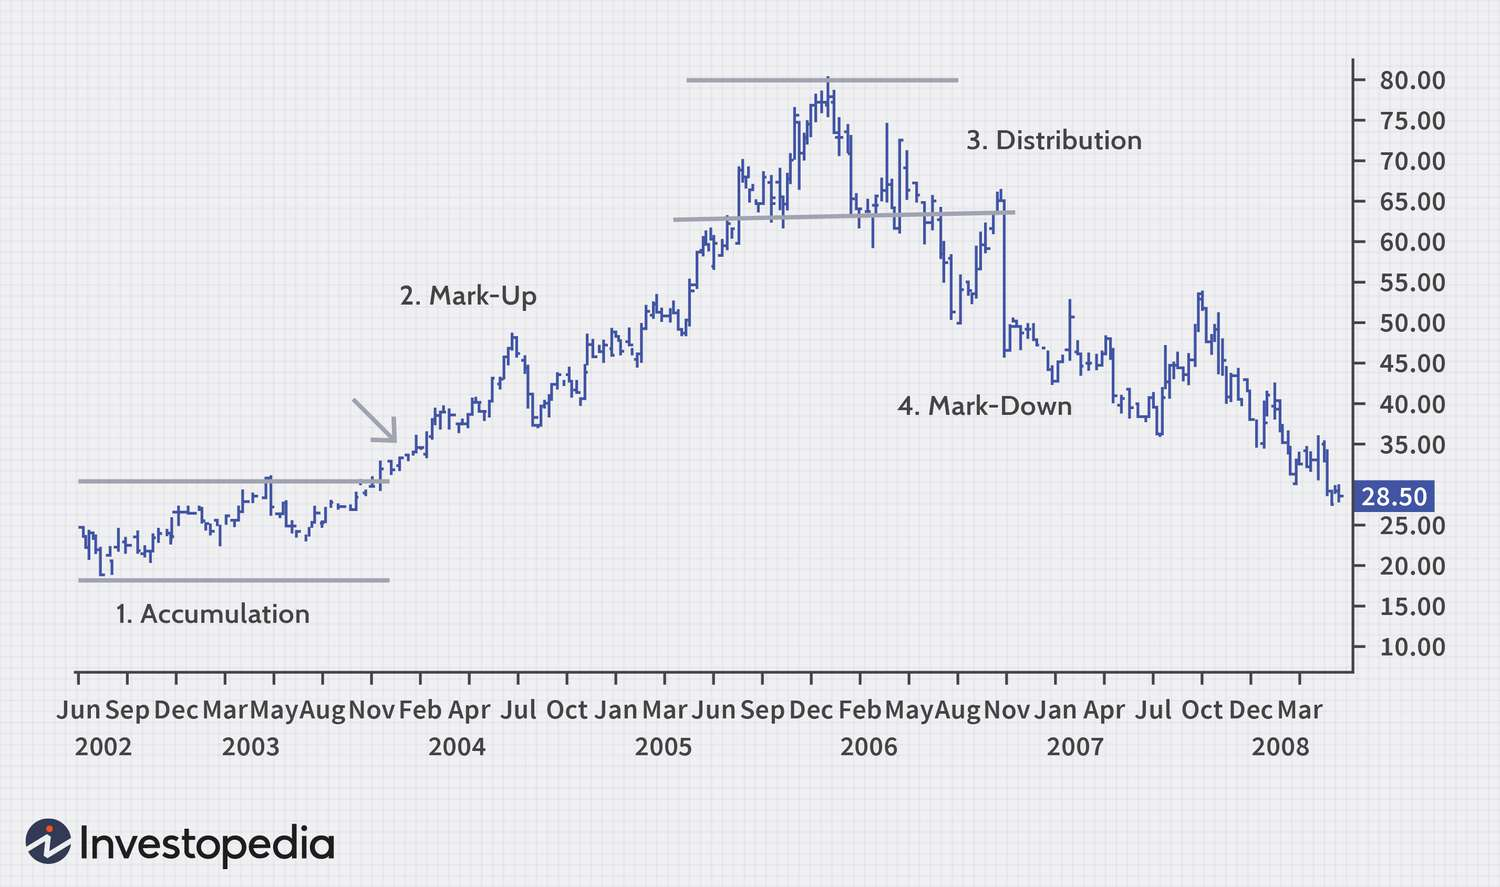
I’m not in the boat yet to say that AMZN is seeing its distribution phase, but it does have that look.
Time will tell.
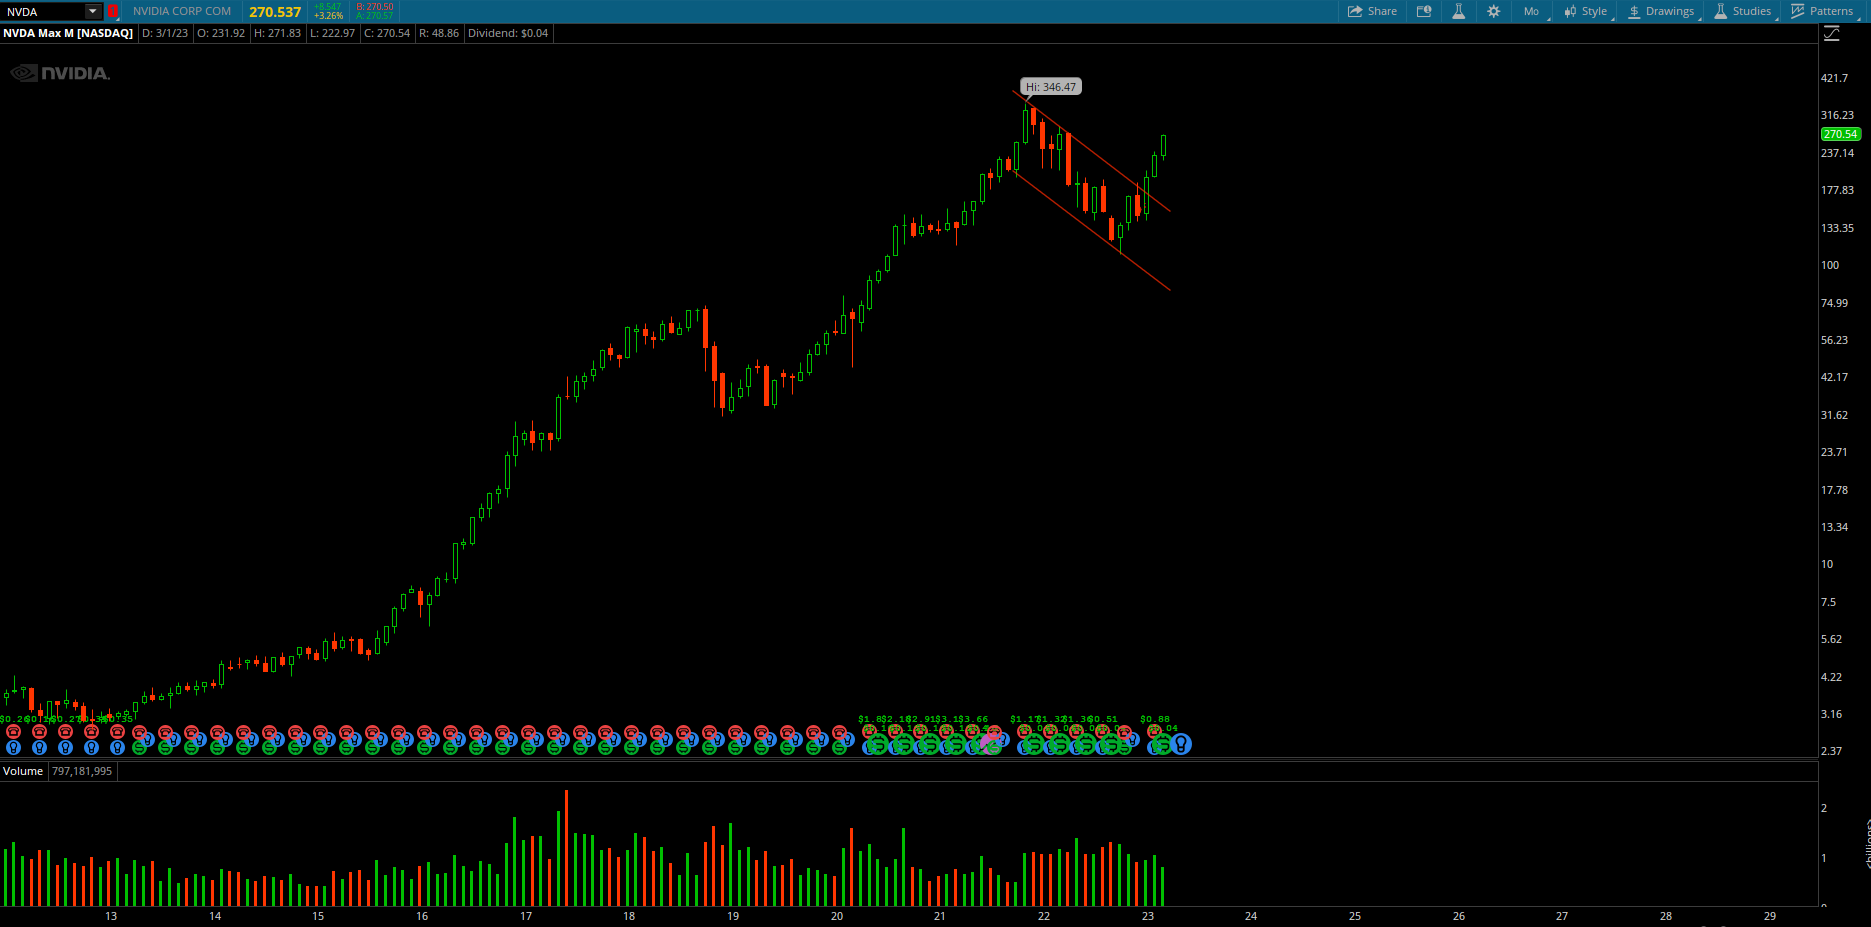
What a stellar move we’ve seen in NVDA over the last few months.
We haven’t seen NVDA bust all time highs, but it is roughly 20% away from ATH and up +150% from the 2022 lows. Nice move overall in semi’s.
NVDA CEO Jensen Huang stated last week that the iPhone moment for AI has begun adding that the company is ready for this advancement.
AI has been the financial markets buzz word in the last few months and NVDA is taking advantage.
If you haven’t seen the new AI developments such as ChatGPT and DALL-E, then you may want to check them out.
To me, they are equally as scary as they are impressive.
Regardless, many analysts and forecasters are seeing AI become the next tech wave and NVDA is targeting to hit this industry in the coming months and years.
Speaking of AI…
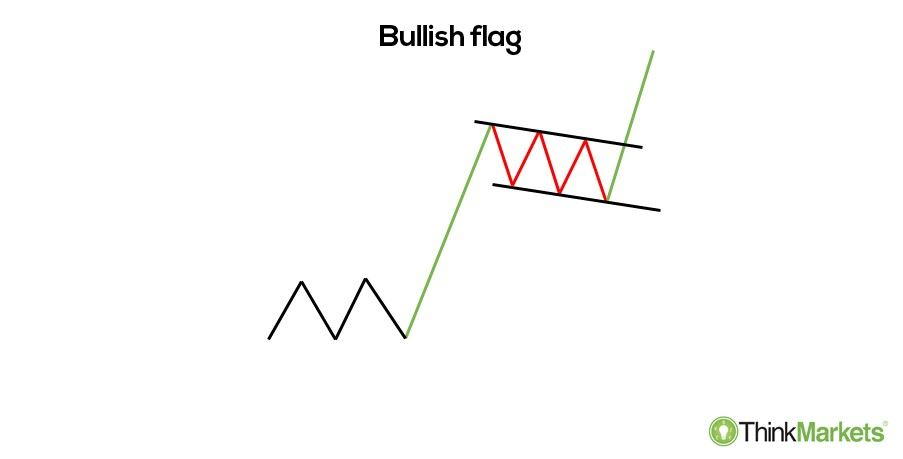
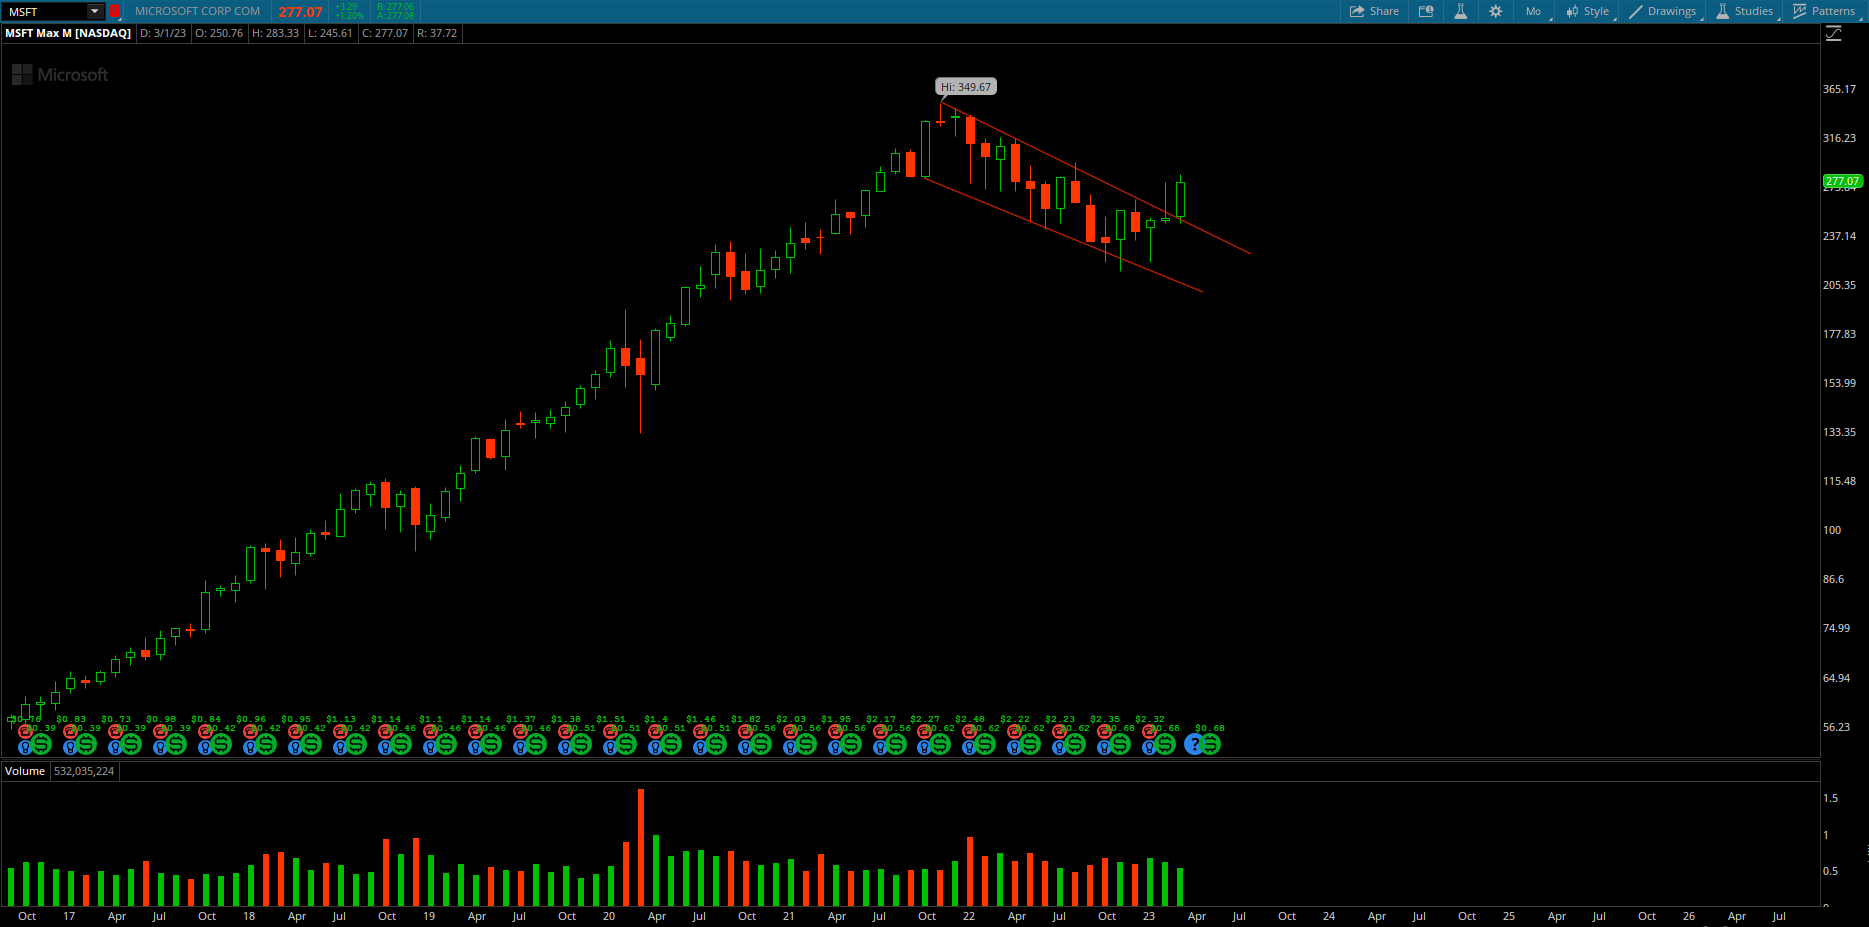
MSFT is also diving into AI as well.
We’re seeing the stock breakout of a monthly bull flag.
MSFT, AAPL, and NVDA all look like solid charts – these are some of the largest names in the S&P right now.
On the other hand, we’re seeing healthcare become the laggard in 2023.
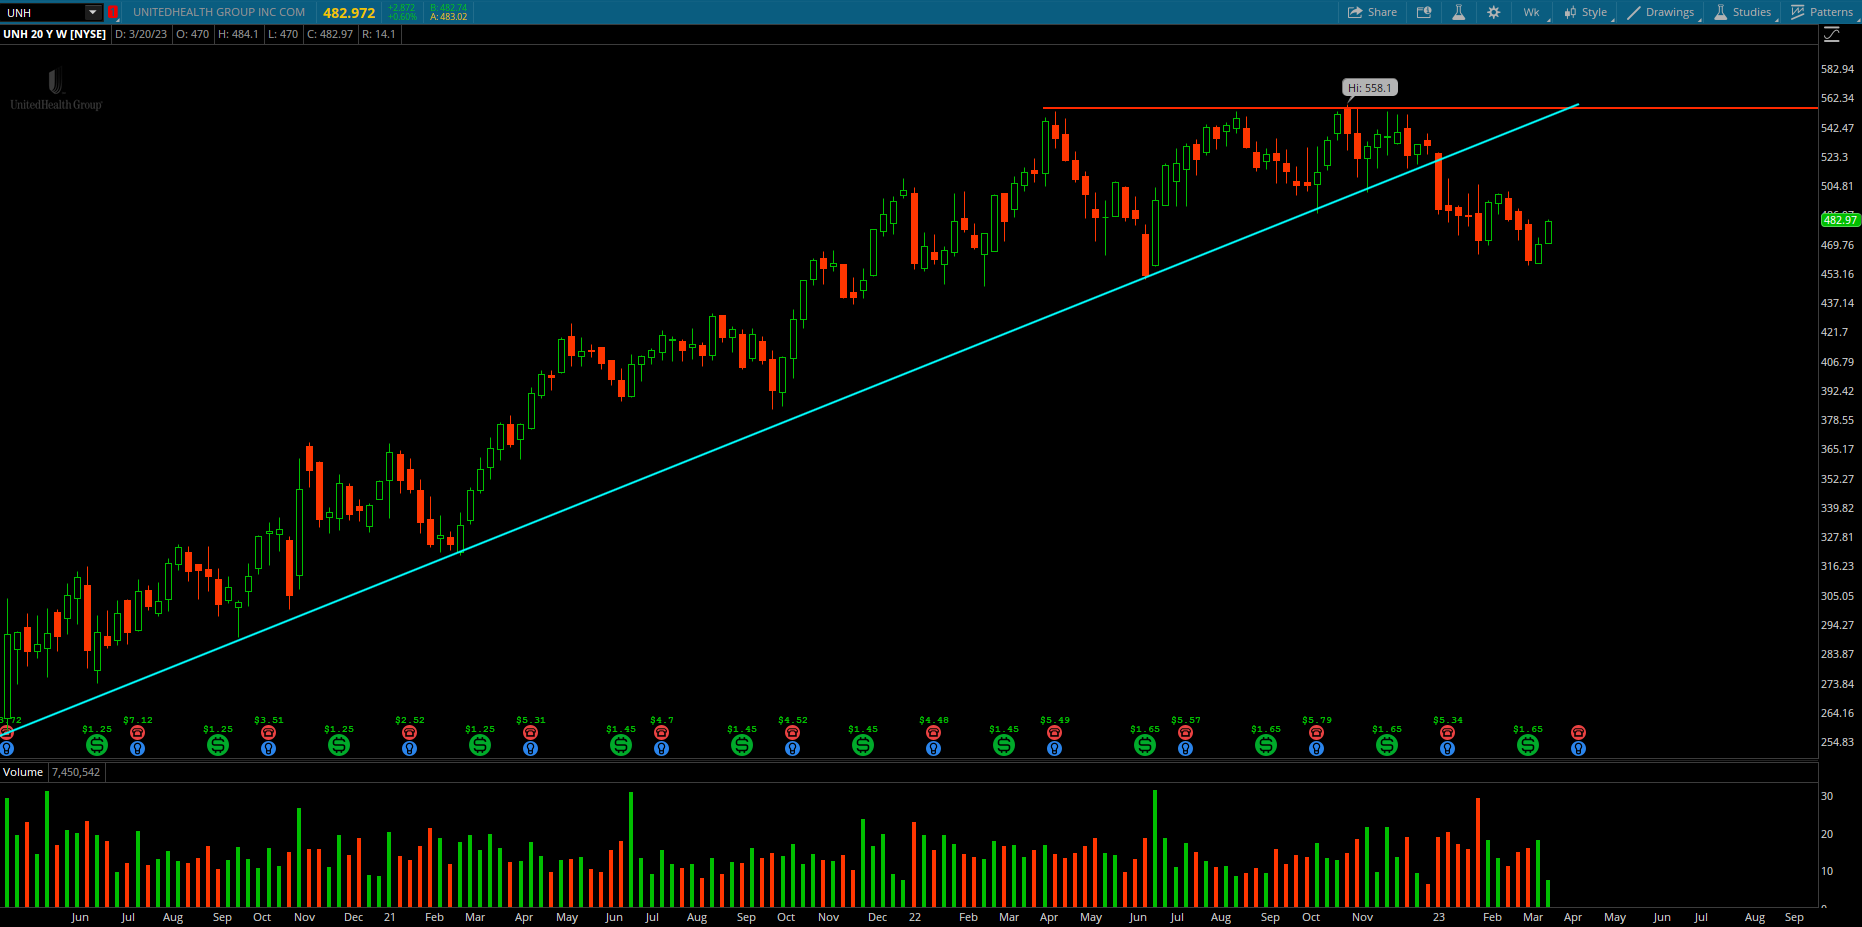
This was the most bearish chart when I dropped my 2023 outlook.
We’ve seen UNH fall as much as 14% YTD.
This breakdown of long term trendline support (Blue line) is a massive indication of healthcare.
I wouldn’t be surprised to see a retest of this area and see if this acts as resistance.
If you were in 2-Day Trader at the end of December, you’ll remember my bearishness on healthcare names such as UNH and JNJ.
JNJ has fallen 15% YTD as I’m writing this.
We’re also starting to see the rotation out of energy names.
XOM is down 14% from the February highs.
All in all, tech is trying its best to lead the S&P higher.
So where does this leave us for Q2?
Well, we overall have a mixed bag from different sectors.
And I can’t come up with a reason for why that won’t continue.
I expect to see a lot of rotation between sectors this next quarter with pockets here and there.
A lot of the growth names will be dependent on FED news.
Unfortunately, we have seen the market act in a similar fashion.
We see weeks of range bound price action until new macro data or new Powell rhetoric.
I expect to see a wide trading range in Q2 of 2023 and I’m not ruling anything out.
Tail events can come when we least expect it – to the upside or to the down side.
If you learned anything from 2022 and Q1 of 2023, it is best to nimble in this market.
Which is why I am confident in the 2-Day Trader system moving forward.
The 2-Day Trader model portfolio is currently 1.53% off it’s all time highs that was hit just a month ago.
I’m looking forward to the next quarter and the action we’ll see in the coming months.
If you have any chart requests, feel free to email me [email protected].
I will add all chart requests to the bottom of this thread.
Have a great end of the week and I’ll speak to you all soon.
Best Regards,
–Dylan